
Page 30 - IB AUG 2019
P. 30
Business
Lifting the anchor per cent and average return on equity of 2.8 per cent during
“The banks generated an average return on assets of 1.2
the 2010–2017 period. Surprisingly, the development banks
were more profitable than the commercial banks, despite their
Can more risk make state-owned lower interest rate spreads,” the report states.
banks more relevant? which between 2012–2017 generated an average return
It compares these rates to those at the Bank South Pacific,
on assets of 3.1 per cent, compared with 0.4 per cent for
the state-owned commercial banks and 1 per cent for the
By Samantha Magick development banks.
The report attributes low profitability to “weak credit risk
A new Asian Development Bank report says Pacific state- assessment practices and the absence of a pervasive com-
owned banks need to change their attitude to risk if they are mercial culture. In particular, the development banks have
to fulfil their potential to improve competition and deepen suffered high levels of non-performing loans and limita-
the credit markets of Pacific island nations. tions on their funding sources, which have pushed down
The Finding Balance 2019 report profiles the roles, per- profitability.”
formance, market context, and regulatory framework of 13 Report co-author Peter Dirou says developing the capability
state-owned banks in 10 Pacific island countries. It finds that of these banks to assess risk and make credit assessments
as a group, these banks generated a very low financial re- would open up the availability of finance.
turn on their investment for their shareholders, and that the “It’s like this big anchor that’s attached to these countries
“underlying pressures on profitability need to be addressed and you’re just dragging ourselves down because we’ve
if these banks are to play a longer term role.” weighed ourselves down. We didn’t need that anchor, if we
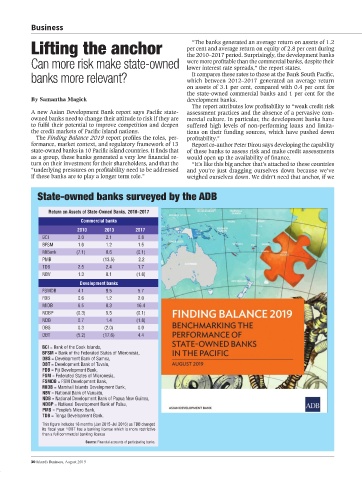
State-owned banks surveyed by the ADB
Return on Assets of State-Owned Banks, 2010–2017
Commercial banks
2010 2013 2017
BCI 2.0 2.1 0.8
BFSM 1.6 1.2 1.5
MiBank (7.1) 0.6 (0.1)
PMB (13.5) 2.2
TDB 2.5 2.4 1.7
NBV 1.3 0.1 (1.8)
Development banks
FSMDB 4.1 9.5 5.7
FDB 0.6 1.2 2.0
MIDB 6.5 0.3 16.4
NDBP (0.3) 5.5 (0.1)
NDB 0.7 1.4 (1.8)
DBS 0.3 (2.0) 0.0
DBT (5.2) (17.6) 4.4
BCI = Bank of the Cook Islands,
BFSM = Bank of the Federated States of Micronesia,
DBS = Development Bank of Samoa,
DBT = Development Bank of Tuvalu,
FDB = Fiji Development Bank,
FSM = Federated States of Micronesia,
FSMDB = FSM Development Bank,
MIDB = Marshall Islands Development Bank,
NBV = National Bank of Vanuatu,
NDB = National Development Bank of Papua New Guinea,
NDBP = National Development Bank of Palau,
PMB = People’s Micro Bank,
TDB = Tonga Development Bank.
This figure includes 18 months (Jan 2015–Jul 2016) as TDB changed
its fiscal year. DBT has a banking license which is more restrictive
b
than a full commercial banking license
Source: Financial accounts of participating banks.
30 Islands Business, August 2019